3줄 요약
- GameDiscoverCo의 Simon Carless가 데이터 파트너 Gamalytic과 함께 2023년 9월 이후 출시된 Steam 게임 약 700개 표본을 분석해, 위시리스트 → 1개월 판매 전환률의 분포·평점·얼리액세스·가격대·태그별 차이를 정리했다.1
- 핵심 발견은 평점 라벨의 임계값에서 전환률이 비선형적으로 점프한다는 것이다. Overwhelmingly Positive(95%+) 구간에서 0.51배로 크게 도약하고, Mixed(<70%) 구간에서 두드러진 하락이 관찰된다.
- 얼리액세스 게임은 동일 시점 정식 출시작 대비 1개월 전환률이 약 1/3 낮으며(0.20배 vs 0.30배), 가격대는 저가($10 미만)·고가($50+)에서 전환률이 높고 $15~30 구간이 평균을 밑도는 U자형이다.
표본과 측정 방식
Gamalytic이 분석한 표본은 다음 조건을 만족한다.
- 2023년 9월 이후 출시된 Steam 게임
- 위시리스트 5,000개 이상
- 출시 첫 달 판매 500부 이상
- 표본 크기: 약 700개 게임
원문 인용:
“around 700 [Steam] games released after September 2023 with at least 5,000 wishlists, and at least 500 copies sold within the first month.”
측정 단위는 “출시 시점 위시리스트 대비 1개월 판매량”의 비율(이하 ‘M1 전환률’)이다. 1.0배는 위시리스트 1개당 첫 달 판매 1부를 의미한다.
Gamalytic의 Strale은 중간값을 다음과 같이 정리한다.
“We have median Month 1 sales as 27% of launch wishlists and median Week 1 sales at 22% (23% and 17% respectively if we don’t filter out games that sold <500 copies within m1.) This aligns with GameDiscoverCo data btw, where they had W1 at around 20%.”
1. 백분위수별 전환률 — “wildly varies”
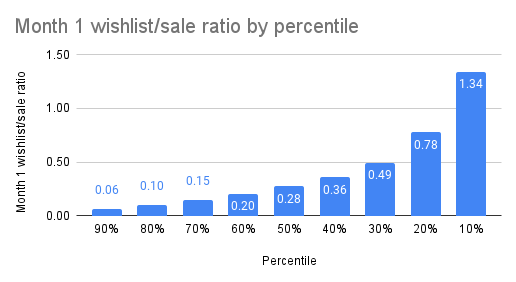
Carless의 표기 그대로 옮긴다. 본 원문은 백분위수를 통상 통계 관례와 반대로 “상위에서 본 순위"로 쓴다 — 즉 “10th percentile"이 상위 10%, “90th percentile"이 하위 10%다.
| 백분위수 (Carless 표기) | M1 전환률 | 풀이 |
|---|---|---|
| 10th percentile (최상위 10%) | 1.34배 | 위시리스트 100,000 → 첫 달 134,000부 |
| 중간값 | 0.27배 | 위시리스트 100,000 → 첫 달 27,000부 |
| 90th percentile (최하위 10%) | 0.06배 | 위시리스트 100,000 → 첫 달 6,000부 |
원문 인용:
“the worst — 90th percentile — has 0.06x conversion (100,000 wishlists, 6,000 sales in Month 1.) And the best — 10th percentile — has 1.34x conversion (100,000 wishlists, 134,000 sales in Month 1.)”
같은 위시리스트 규모를 갖춘 게임 사이에서 1개월 매출이 22배 이상 벌어진다.
2. 평점 라벨별 전환률 — 임계값에서의 비선형 점프
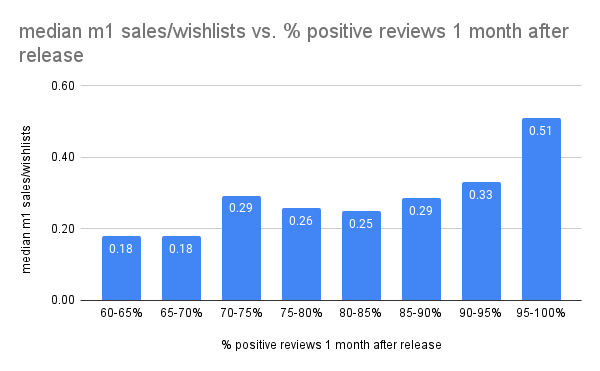
이 자료의 핵심 발견이다. 원문 인용:
“higher-rated games do the best compared wishlists, as a median. You’ll see a particular jump in the Overwhelmingly Positive category (95%+ — well, if you’ve got >500 Reviews!) at a whopping 0.51x wishlist balance as Month 1 unit sales.”
“looks like it’s the Mixed reviews stage (<70%) where you see significant conversion dropoffs. Why? Mostly Positive and above — after a month — indicates the game is essentially ‘safe’ for people to buy, and quality isn’t affecting conversion.”
요지:
- Overwhelmingly Positive (95%+, 리뷰 500개 이상) 구간에서 M1 전환률이 0.51배로 점프한다 — 중간값(0.27배)의 약 두 배다.
- Mostly Positive 이상은 “구매해도 안전"하다는 신호로 작동해, 평점이 더 올라가도 전환률에 큰 차이를 만들지 않는다.
- Mixed(<70%) 구간에서는 큰 하락이 나타난다.
평점 점수는 연속적으로 변하지만 매출 전환은 라벨 단위로 계단식으로 움직인다 — 이 자료가 보이는 가장 중요한 시사점이다.
3. 얼리액세스 vs 정식 출시
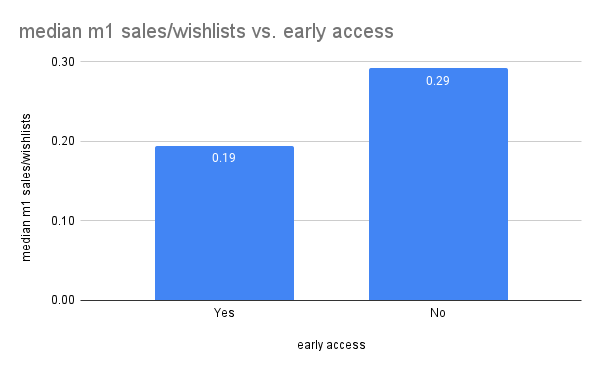
“Early Access games convert worse than their full release counterparts. Early Access games have median Month 1 sales as around 20% of their launch wishlists, while full release games have their median at around 30% of their launch wishlists.”
| 출시 방식 | M1 전환률 중간값 |
|---|---|
| 얼리액세스 | 0.20배 |
| 정식 출시 | 0.30배 |
EA는 정식 출시 대비 약 1/3 낮은 전환률을 보인다. 다만 Carless는 EA가 향후 정식 출시로 “만회(comeback)“할 기회를 갖는다는 점을 함께 언급하며, 이 데이터만으로 EA 채택 여부를 결정할 이유는 없다고 부언한다.
4. 가격대별 전환률 — U자형
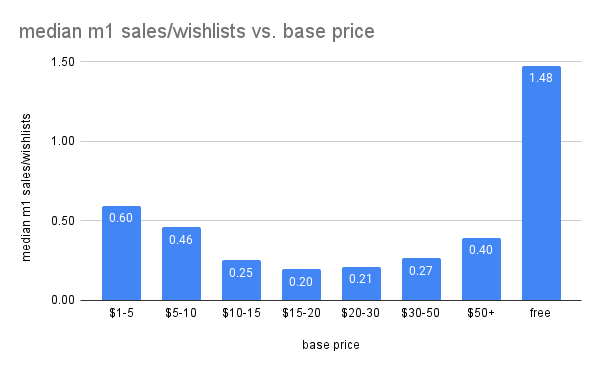
전환률은 가격대에 대해 U자형(양극단 우위) 분포를 보인다.
- $10 미만: 위시리스트가 적게 쌓이는 대신 충동·유기적 구매 비중이 커져 전환률이 높다.
- $15~30: 프로/세미프로 인디 게임이 집중되는 구간으로 전환률이 평균 또는 그보다 약간 낮다.
- $50+: 게임 수 자체가 적고, ’trad AAA’ 게임에서는 바이럴 위시리스트가 덜 발생해 전환률이 다시 높아진다.
원문 인용:
“a lot of smaller <$10 games get less wishlists overall, and more spontaneous organic buying because they’re cheaper. So you get a high ’launch wishlists to Month 1 sales’ rate.”
“when you get to the $15-$30 range, that’s where the majority of the pro or semi-pro games come in, and you get more towards ’normal’ success rates.”
“$50+ gets higher success rates, because there’s less of those games. And maybe viral wishlisting happens less with ’trad’ AAA sometimes?”
5. 태그별 전환률
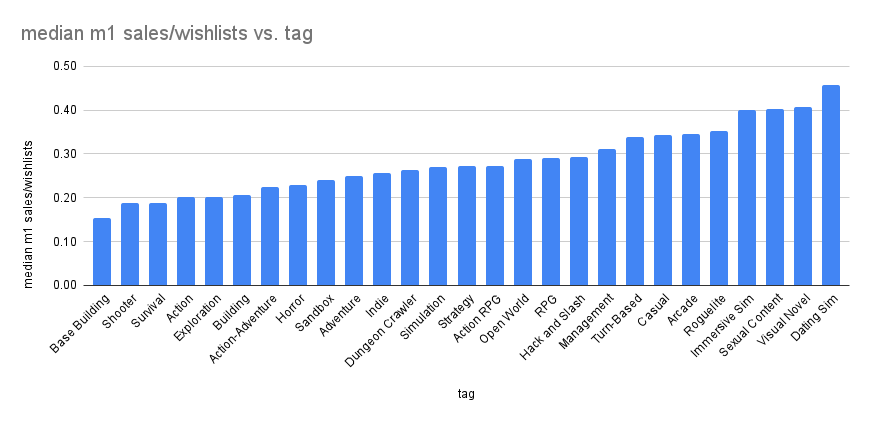
원문은 “데이터가 더 필요할 수도 있다"는 단서를 단다. 다만 Visual Novel·Sexy 같은 니치 태그가 위시리스트 대비 전환률 상위에 위치한다.
“the top-converting tags aren’t the ones that get the most wishlists. They just do well compared to the wishlists they do get.”
전환률이 높다고 시장이 큰 것은 아니다 — Carless는 Visual Novel을 두고 “포화 시장이라 대부분의 상업 개발자에게는 권하지 않는다"고 직접 언급한다.
가장 흥미로운 지점
이 자료의 진짜 발견은 임계값 비선형성이다.
평점 점수는 0~100% 범위에서 연속적으로 변하지만, Steam은 이를 9단계 라벨(Overwhelmingly Positive / Very Positive / Positive / Mostly Positive / Mixed / Mostly Negative / Negative / Very Negative / Overwhelmingly Negative)로 묶어 표시한다. 매출 전환률은 점수가 아니라 라벨 경계에서 점프한다.
두 군데가 결정적이다.
- Mixed(<70%) ↔ Mostly Positive(70~79%) 경계 — 여기서 큰 하락이 발생한다.
- Very Positive(80~94%) ↔ Overwhelmingly Positive(95%+) 경계 — 여기서 0.27배 중간값이 0.51배로 도약한다.
평점이 1~2%포인트 차이로 라벨 경계를 넘는지 못 넘는지가 매출에 비례 이상의 영향을 준다는 뜻이다. 70%와 69%, 95%와 94%의 차이는 점수상 거의 없지만 매출 결과는 그렇지 않다.
여기에 얼리액세스 변수를 더하면 함의는 더 무거워진다. EA는 출시 시점 평점이 정식 출시 대비 후행하기 쉬운데, 그 1~2%포인트가 Mixed 라벨에 갇히는 결과로 이어지면 전환률은 단순히 “1/3 낮음"이 아니라 임계값 효과까지 겹쳐 누적된다.
출처
- 발행: GameDiscoverCo Newsletter, 2024년 5월 1일
- 저자: Simon Carless (GameDiscoverCo 창립자)
- 데이터 파트너: Gamalytic (Strale)
- 원문: https://newsletter.gamediscover.co/p/how-user-reviews-affect-your-games
이미지는 모두 GameDiscoverCo 뉴스레터 본문에서 인용했으며, 원본 데이터는 Gamalytic이 공개 Steam 데이터를 리버스 엔지니어링한 결과다.
Gamalytic 원본 분석: https://gamalytic.com/blog/exploring-steam-wishlist-sale-ratio ↩︎